Click me to see the poster ٩(^ᗜ^ )و ´-
Introduction
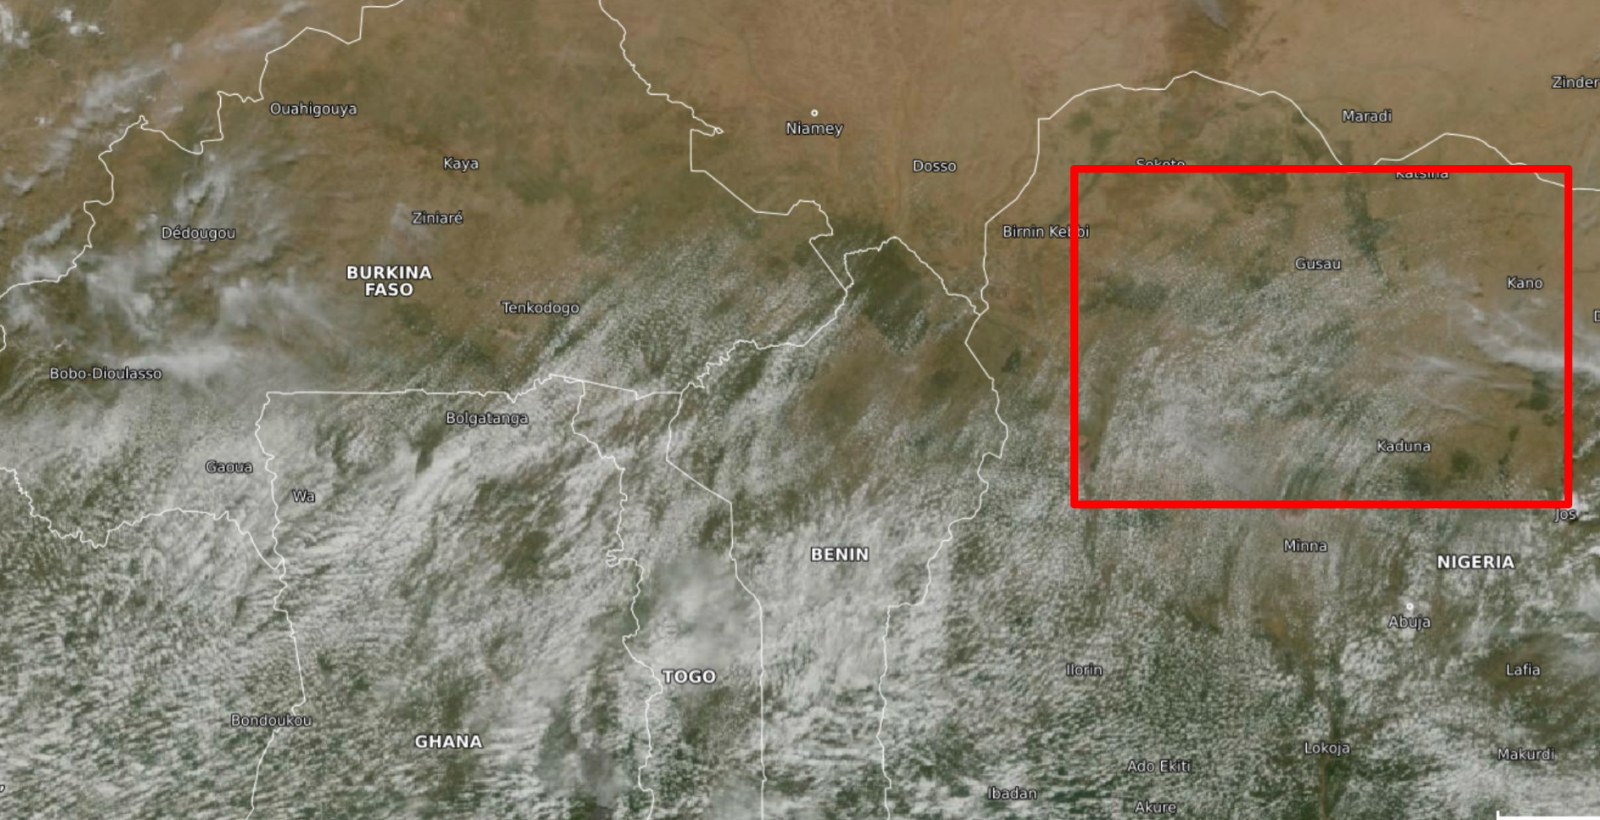
This project investigates the development of cloud streets (long, parallel rows of clouds) over the Sahel. Specifically, we want to understand how pre-existing soil moisture (SM) influences cloud formation over this region! This soil moisture can be affected by things like irrigation and vegetation which are important for the people living there, especially since many of them rely on rain-fed agriculture.
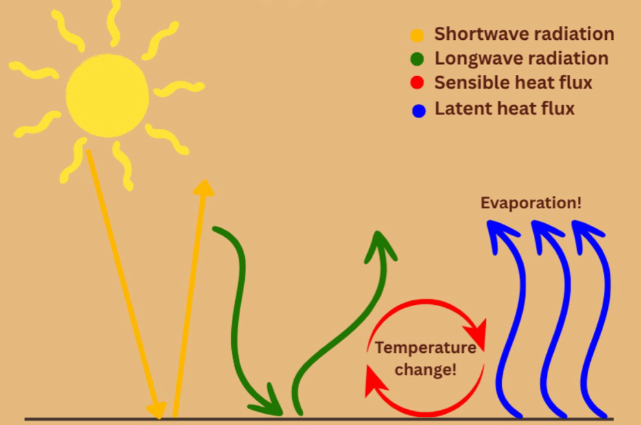
Surface Energy Budget
Five simulations with varying soil moistures (0%, 25%, 50%, 75%, 100%) were run using the Regional Atmospheric Modeling System (RAMS) to model the surface energy budget and cloud development. The surface energy budget is the total balance of all heat and radiation energy moving into and out of the Earth's surface. Shortwave radiation is energy coming directly from the sun and includes visible light and ultraviolet rays. Longwave radiation is thermal infrared energy emitted by the Earth's surface, atmosphere, and clouds. Sensible Heat Flux (SHF) is heat that moves from the ground into the air via conduction and convection. Latent Heat Flux (LHF) is energy used when water changes state, like when liquid water evaporates into water vapor.
How does the Bowen Ratio change with soil moisture?
The two specific variables in the surface energy budget that were looked at are sensible heat flux, which provides temperature change, and latent heat flux, which provides evaporation and adds moisture to the air. These two fluxes provide us with the Bowen Ratio (BR; β = SHF/LHF). As seen in the plot provided, the Bowen Ratio decreases as the soil moisture increases. This is because higher soil moistures have a higher LHF since there is more water to evaporate.
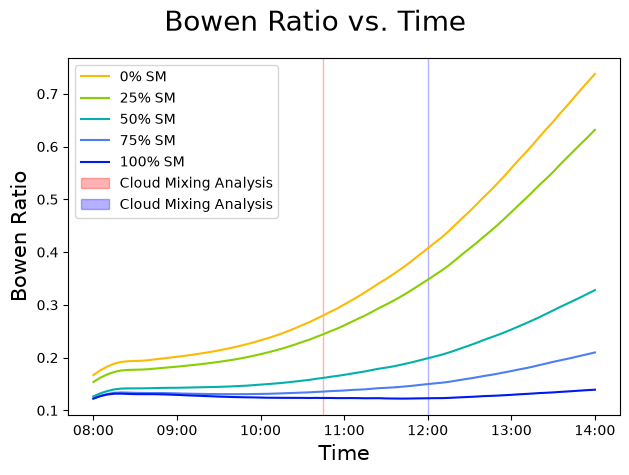
The Bowen Ratio critically affects two key heights: the lifting condensation level (LCL) and the planetary boundary layer (PBL). The PBL rises with increasing SHF, promoting vertical lifting, while the LCL lowers with increasing LHF, enhancing moisture availability. For cloud formation to occur, the LCL must be at or below the PBL height.
How does this affect cloud formation?
Now that we know how the Bowen Ratio changes with pre-existing soil moisture, what does this have to do with the formation of clouds let alone cloud streets???
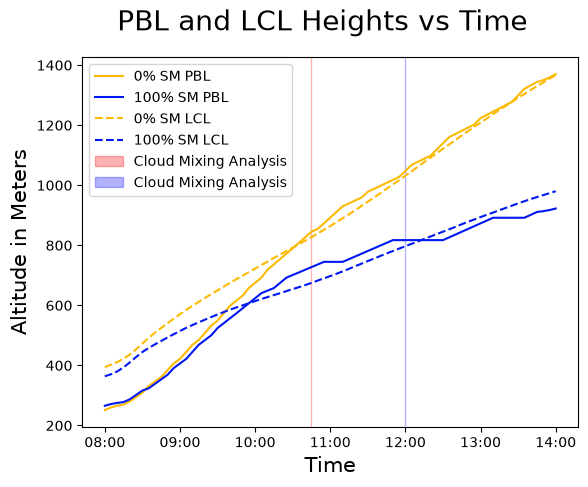
As SHF increases, the PBL increases as well, giving the air parcels more lift. As the LHF increases, the LCL decreases, which is the altitude where a rising air parcel cools enough through expansion to reach 100% relative humidity. In order to get clouds, we want the LCL to be close to or below the PBL because if the PBL is too low, the air parcels will return to Earth’s surface before they have the chance to become clouds.
The plot below shows that the lower soil moisture run has a higher PBL and LCL on average compared to the higher soil moisture run. We also see that the LCL and PBL meet a little after 10:00 in the higher SM run whereas the lower SM run shows the LCL and PBL meeting closer to 11:00. Basically, clouds form later in the day the lower the soil moisture is.
Show us the clouds!
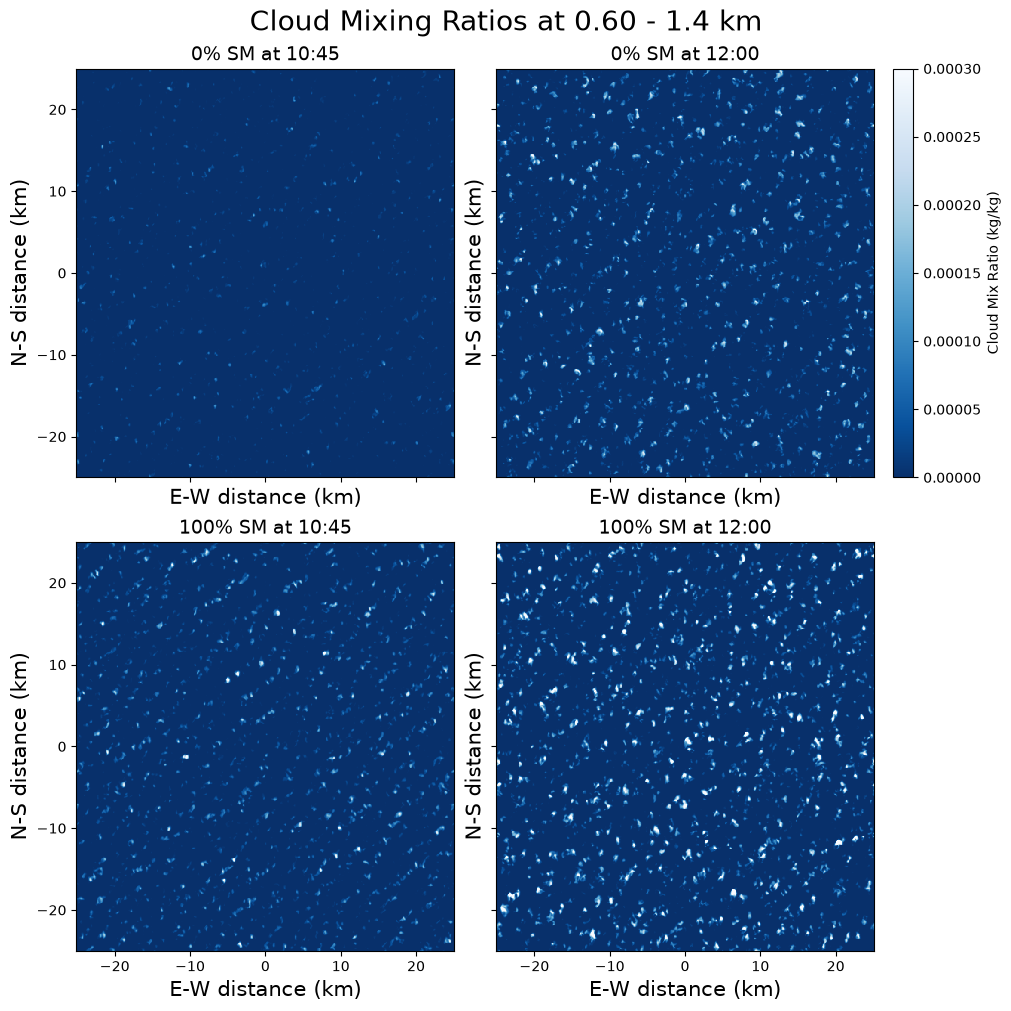
To illustrate the actual formation of clouds, the cloud mixing ratio was used! This is where the air in the atmosphere is well-mixed enough to form clouds. As seen in the plot below, the higher SM level starts to form clouds earlier in the day and they’re also in the street formation! As the day progresses, the clouds in the higher SM separate into a more cellular formation while the lower SM run is just starting to form clouds. However, compared to the higher SM run, the lower SM clouds do not form in a street formation.
Source?
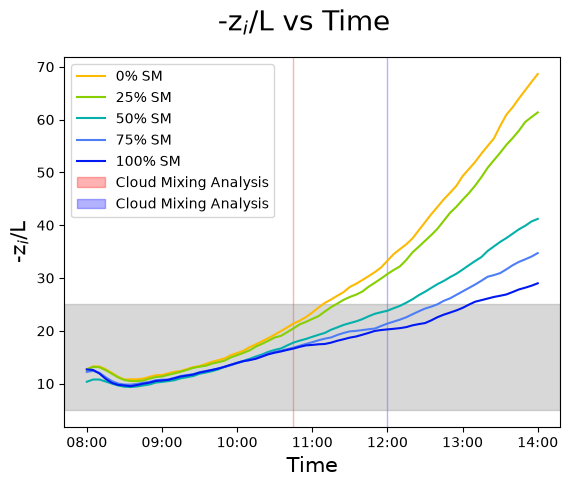
I promise I’m not pulling your leg! The presence of cloud streets (or lack thereof) can be proven mathematically! By taking the negative value of the PBL (-Zi) and dividing it by the Monin-Obukhov length (L), we get the roll threshold parameter. The PBL favors convective rolls (gives us cloud streets) if the values are between 5 and 25 (Weckwerth et al. 1999).
The plot below shows us that the higher SM run spends more time in the region where cloud streets are favored than the lower SM run!
Future Questions
- How does pre-existing soil moisture affect precipitation?
- Do these cloud streets tell us anything about when and where rain will fall?
Acknowledgements
Huge thanks to the NSF for funding the STORM REU, all the awesome friends I made at UW, my super cool mentor Bee, and BIG Z for making this possible.